
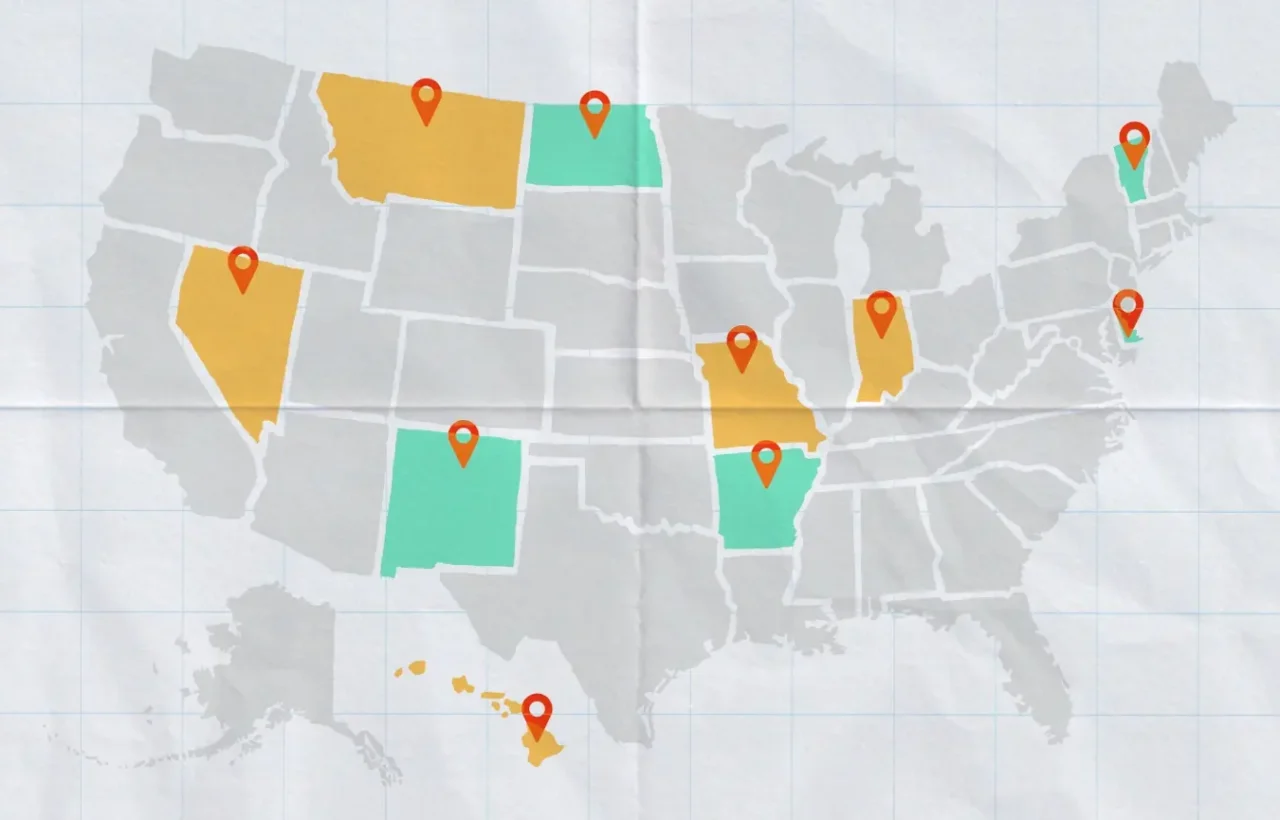
I know how much where I live can change the cost of raising a family, especially when it comes to childcare. In some states, childcare can take up as much as 23% of my income, while in others, it may cost me nothing at all.
Inspired by this post on Baby Center.

FAQs
How much can childcare costs vary from state to state?
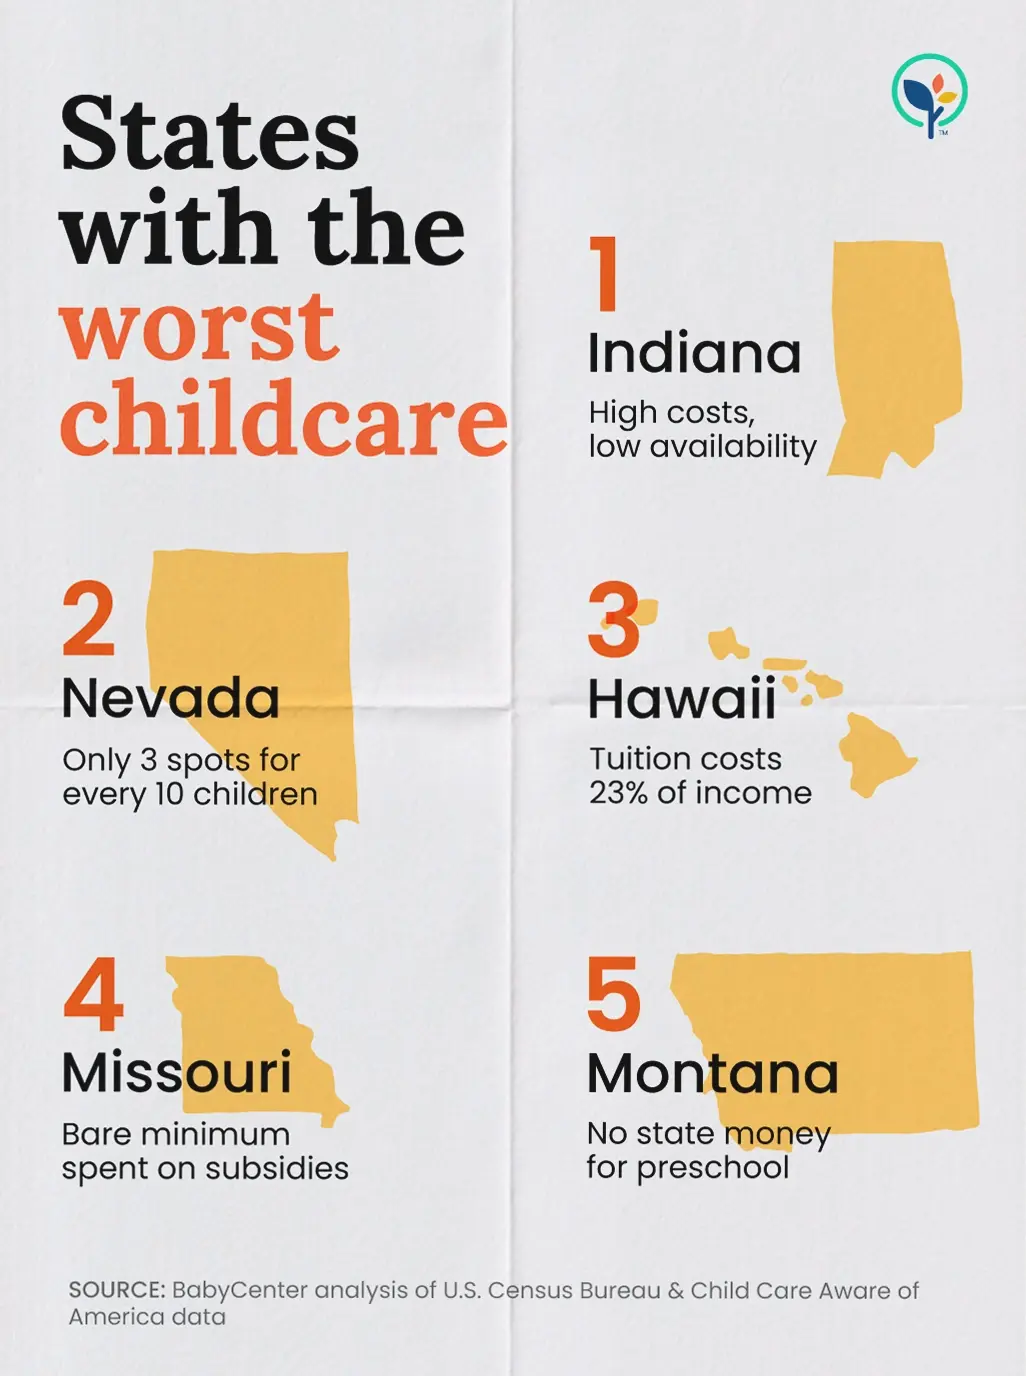
The post says childcare can take up as much as 23% of income in some states. In others, it may cost nothing at all.
Which states are highlighted as the worst for childcare?
The infographic highlights Indiana, Nevada, Hawaii, Missouri, and Montana as the five worst states for childcare access and costs.
Why do some states rank poorly for childcare?
The post points to high costs, limited availability, gaps in subsidies, and challenges with preschool funding as factors behind weaker childcare rankings.
Which states are highlighted as the best for childcare?
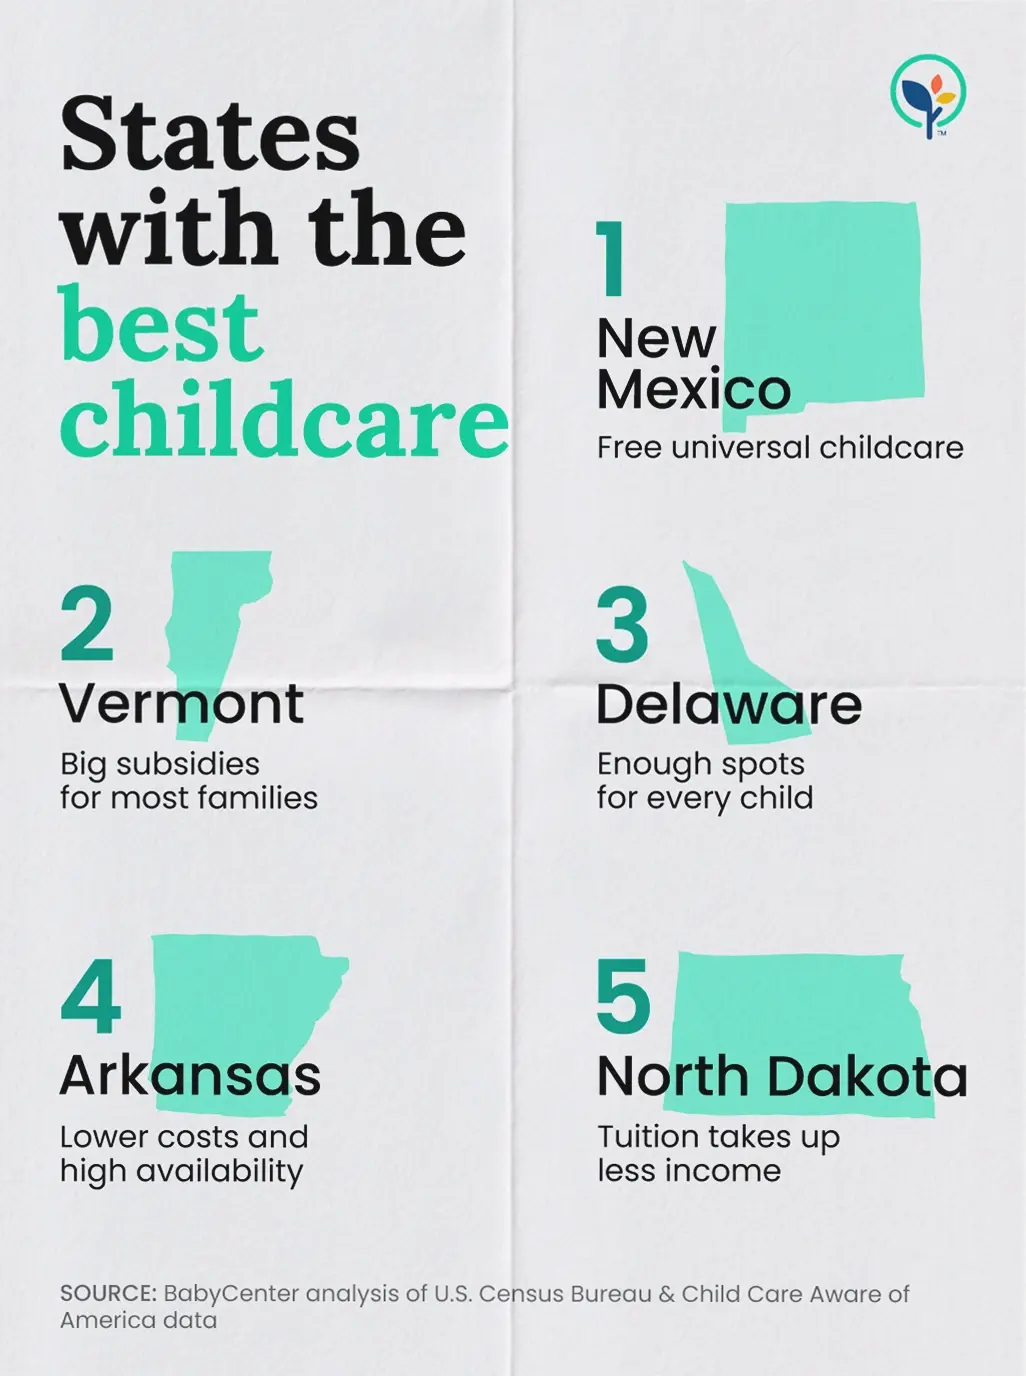
The infographic highlights New Mexico, Vermont, Delaware, Arkansas, and North Dakota as the five best states for childcare.
What childcare support is highlighted in New Mexico?
The infographic caption highlights New Mexico for offering free universal care.
What helps a state rank as a better place for childcare?
The comparison emphasizes stronger family support, lower childcare costs, and better availability. New Mexico’s free universal care is one example highlighted in the post.
What source inspired this childcare ranking post?
The post says it was inspired by a BabyCenter article about the best and worst states for childcare.